Measuring UI Performance
RHQ is not built to be used by thousands of users at the same time. We rather add features to the page so that it contains maximum information and context so that the users can make the right decisions about their infrastructure. But even then we do care about a responsive and reasonably performing UI (and the system as a whole of course).
Recently I’ve been tasked with researching theperformance of our UI layer. Obviously there are a thousand factors influencing the responsiveness of the UI but for the web app developer,there are only a few s/he can do something about. Those in a nutshell are CPU and memory usage of the web app itself and efficiency in the communication with whatever back-end the webapp is using to pull its data from (usually a DB, but in case of RHQ also the agents). We did quite a bit of testing on database and agent communication but we lacked the performance data for the UI layer of RHQ. There obviously are some candidate pages that one might suspect of a need for performance enhancements but which ones to pick? The first thing to decide was to actually determine how to measure the performance of the system. One of the obvious metrics to use is the response time of the HTTP requests. This would be a good start because it’d give me a basic understanding of where the problems might lie. I’d have the starting point to start my search for performance bottlenecks in the URLs that exhibit slow response times. On the other hand the results could be skewed by environmental parameters out of my control like network lag and such like. But since I had the access to the server I wanted to test on, I could do better by measuring metrics on the server itself. On the server side I have much broader choice of what and how I want to measure. If I wanted to I could even insert "probes" into the server to collect stats that are otherwise unobtainable from outside of the server’s JVM. I needed to test several areas of UI using one common testing "algorithm". I needed to simulate a number of users logging in into the UI and visiting a number of pages from the "same area" (or rather the same page with different query parameters). This simple scenario would give me the least performing areas of UI I could then focus on. To summarize, here is what I was after:
-
don’t bother with response times on the client, i can get the same and more information on the server-side
-
look for memory hogs
-
look for CPU intensive tasks
-
ideally I want to know more than just the URL at which a bottleneck might be.
Measuring the memory can either be done by asking ps command or the
JVM itself can provide the heap dump or summary. Measuring CPU is best
done just by ps. The JVM can also provide a thread-dump on demand.
Neither heap summary nor CPU usage nor the thread-dump can be collected
from within the JVM in a simple way (if at all) so I couldn’t track each
request directly using some kind of probe (i.e. adding a filter that
would collect the data to the RHQ web application). All I could do was
to track the request times (either by configuring the embedded Tomcat to
produce access log or better by configuring the RHQ server itself to
collect response time information about itself
(http://wiki.rhq-project.org/display/RHQ/Response+Time+Filter))
and periodically collect the stats using an external script.
Technologies Used
For generating the load on the server I used JMeter. The nice thing about this tool is that it is easily parametrized by data either on command-line or in CSV files. Checkout the very simple JMeter script that I used to generate the load I needed on the server. The script for starting and stopping the RHQ server and JMeter and collecting the stats on memory and CPU usage was simply written in Bash. I used an R script to generate graphs out of the CSV files that the Bash script produces from the collected data. You can find all the source code at the end of this blog entry, if you are interested in trying it out yourself.
Interpreting The Results
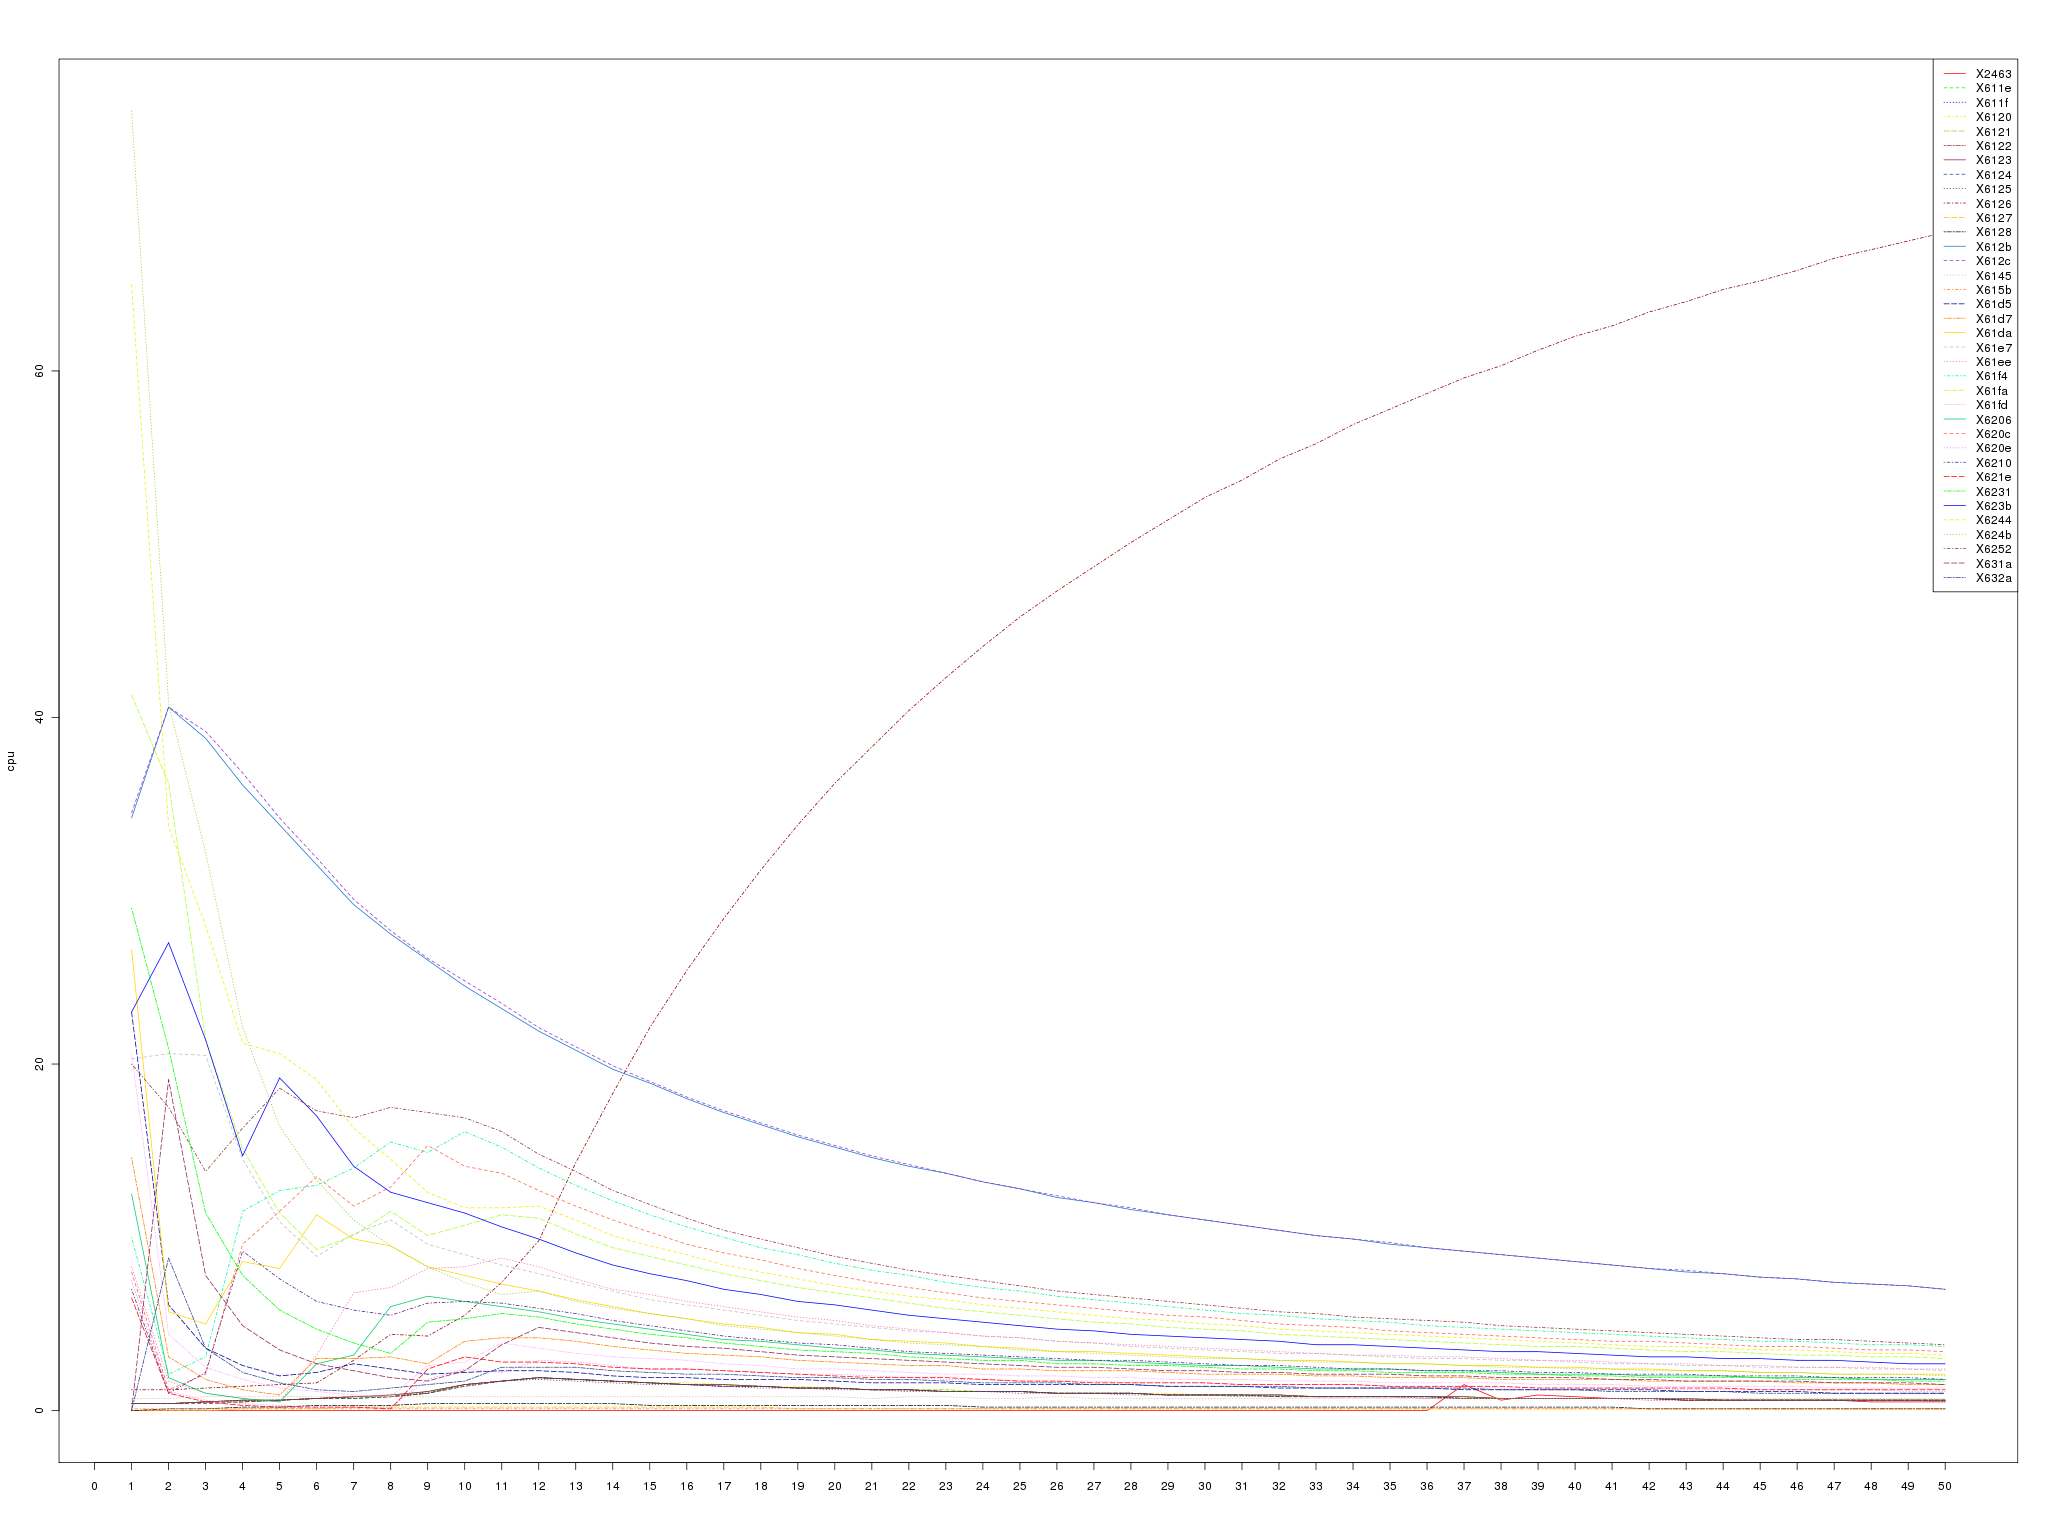
The script collects 3 kinds of statistics. The per-thread CPU usage, the JVM heap summary and the JVM thread dump. The scripts run N iterations and collect the data for each stat in each iteration and store it off in a file. After the script has finished collecting the data, it creates CSV files from the CPU usage and heap summary files for easier consumption of that data. Finally, if R is installed, the CSV files are converted into graphs (yet easier to digest). The JVM thread dump is collected so that one can get a basic idea about what each of the threads in the graph has been doing during the iterations (obviously this is not precise because of the time elapsed between the CPU usage and thread dump collections). Let’s take a look at an example graph of the CPU usage.
In there, you can see that one of the threads dominates the CPU usage in
the later iterations. This obviously is a sign of a problem. Taking note
of the thread id (in the legend of the graph) and comparing it with a
"tid" of the threas in the thread dumps in various iterations reveals
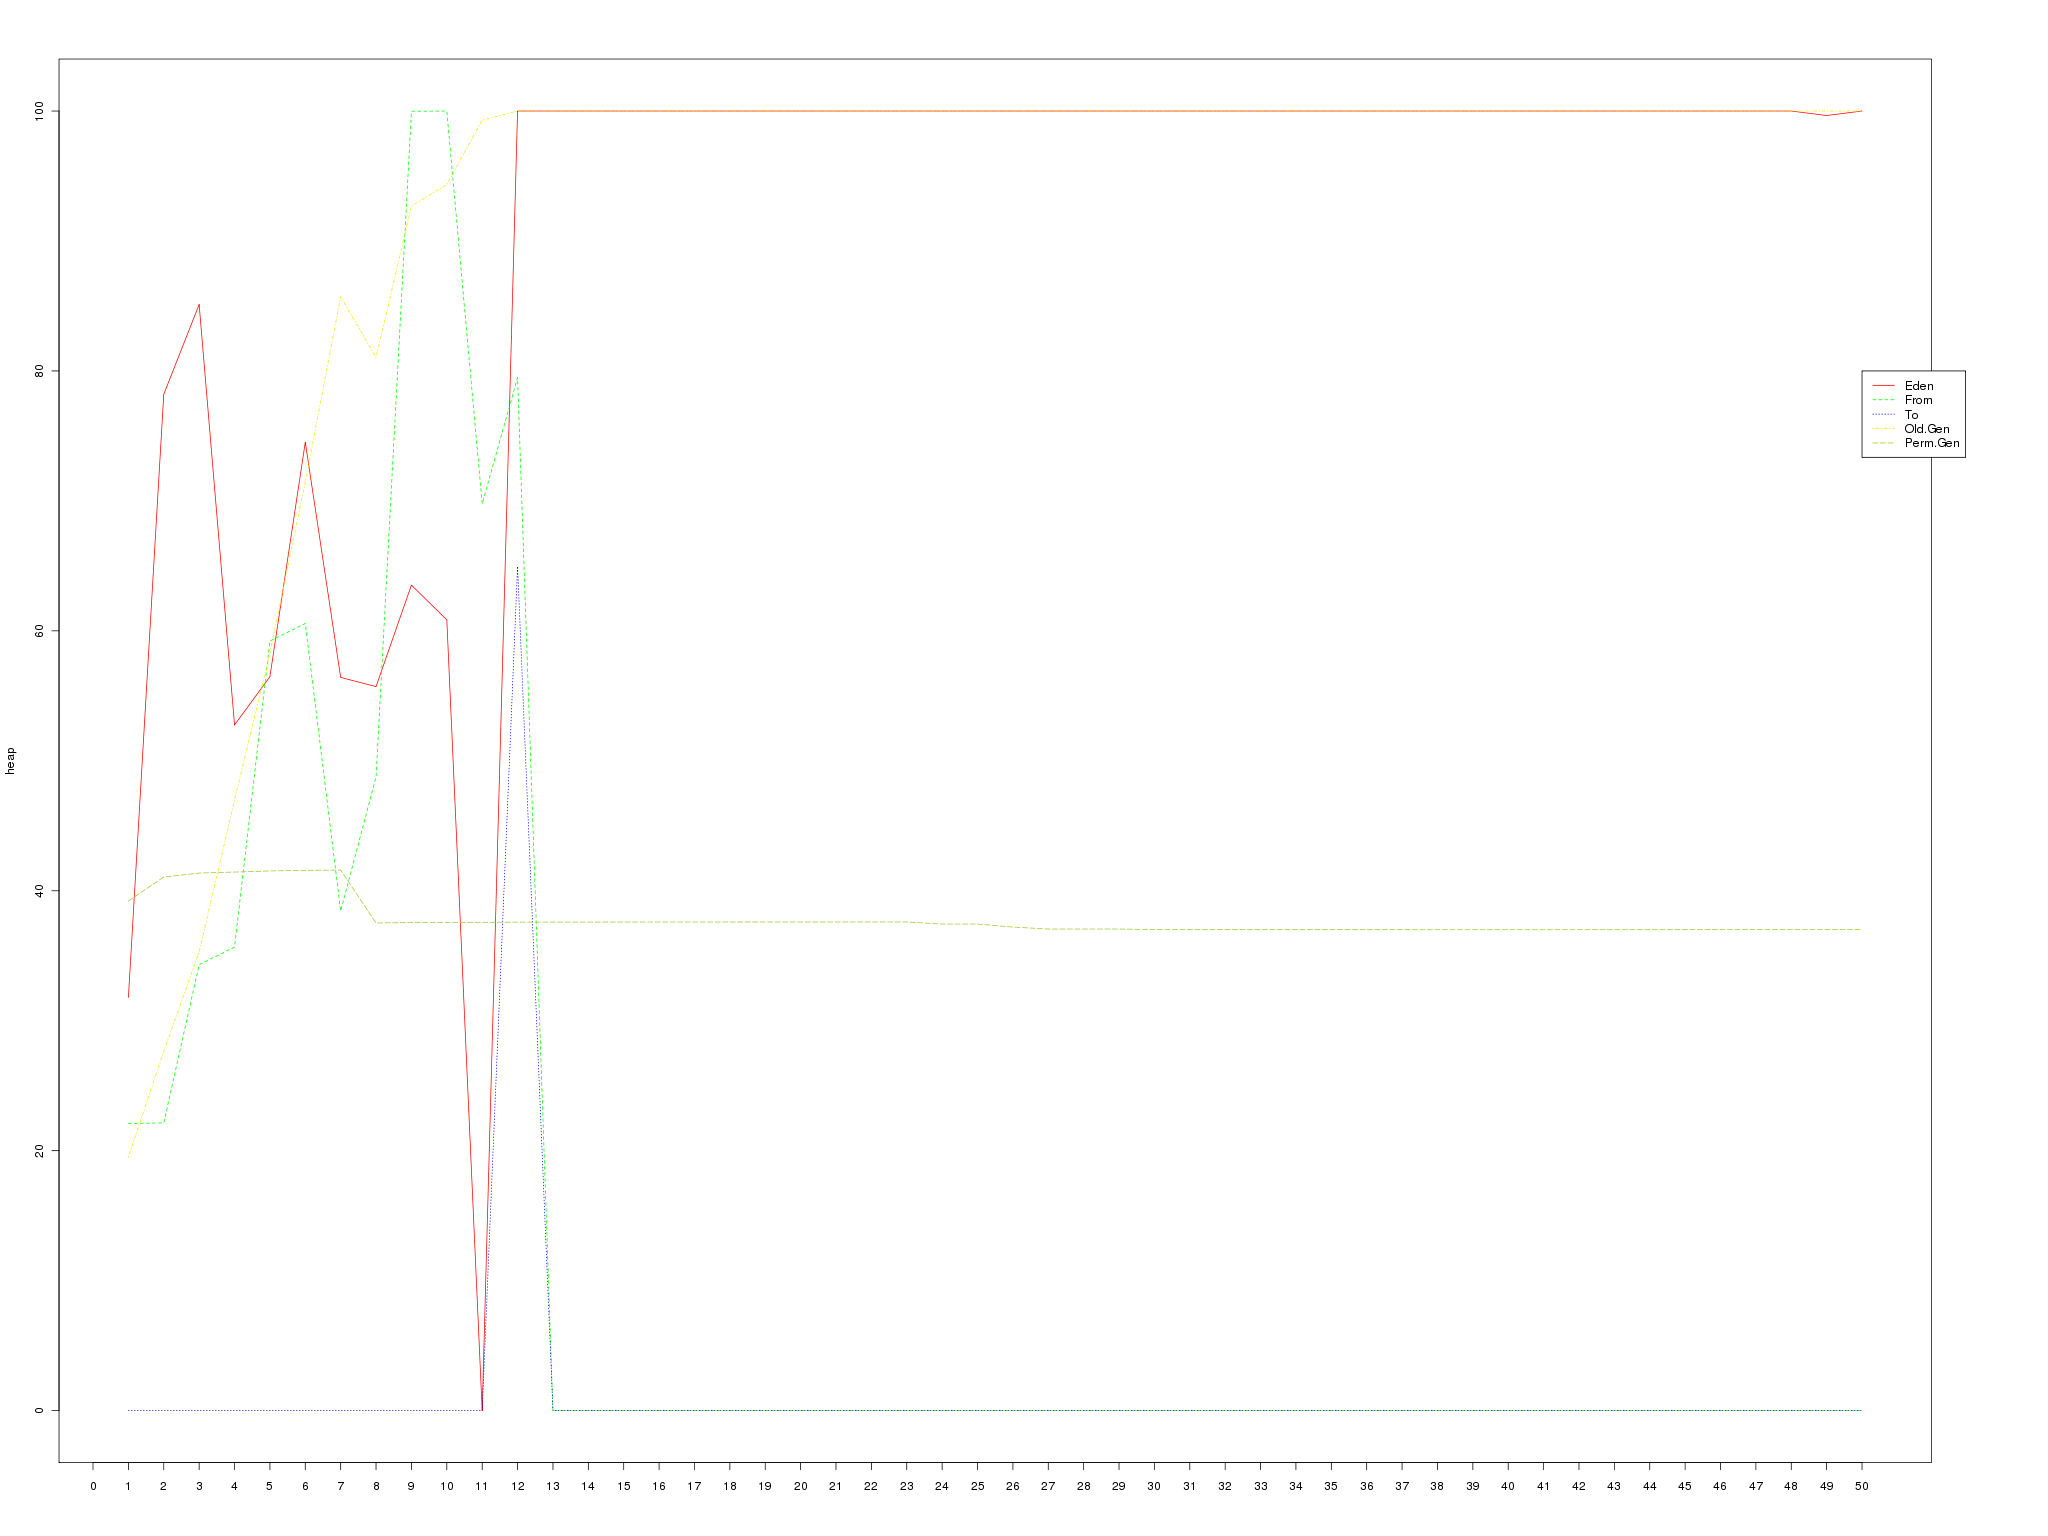
that that is the VM Thread doing garbage collection. Looking at the heap
summary graph
one can easily observe that the application was consuming just too much memory and that the GC, even though it tried really hard, couldn’t handle the load. From that point on, finding the offending code was as easy as taking a full heap dump before and after the test (using the jmap tool that comes with JDK) and finding out which classes contributed the most to the increased memory usage. Eclipse Mat is a great tool for such tasks and finding the code that caused this issue was a breeze.
Tests Layout
If you read all the way down here, you probably are interested in how is this all put together and how does the script obtain all that data. You can find the link to the complete source code at the end of this entry. The zip file you can download contains the bash scripts necessary to run the tests along with an example "test suite" containing the JMeter test file, example input data for it and example tests.
-
*testsuite-runner*the bash script that will start the testsuite in the background
-
*testsuite-run*examines the testsuite directory and spawns the individual tests inside it
-
*test-run*runs a single test (i.e. starts RHQ server, starts JMeter with the test file, collects stats, stops JMeter, stops RHQ server and produces the outputs)
-
example-testsuite contains the testsuite files
-
input a folder containing input data used in the tests. You will have to modify these files in order to make the tests work with your RHQ installation.
-
tests contains the tests directories
-
The example invocation of the script would like like the following:
testsuite-runner path/to/rhq/server/install path/to/jmeter/install NUMBER_OF_STATS_COLLECTIONS path/to/the/testsuite/directory
This command would start the testsuite in the background. For each test in the testsuite, an RHQ server and would be started, then a JMeter instance would be fired up with the test file for given testsuite and a the provided number of stats measurements would be taken in 10 second intervals. After that the JMeter and RHQ servers woul be taken down and the next test in the testsuite would be started.
Future work
Obviously, these scripts are just a quick and dirty solution to my requirements and have much to be added to them to become truly automated and useful. For starters, the tests do not connect to the RHQ database which makes them tied to a particular RHQ inventory (at a defined point in time), because the inputs of the tests hardcode resource ids. The first enhancement would therefore be to rewrite the scripts in a more capable (scripting) language and make them database agnostic.
The source files and an example testsuite can be downloaded from here.

